Seismic Wave
| Name | 3D Quakes |
|---|---|
| Release | 6 Jul 2018 Version 1.0 |
| Explanation | 3D Seismicity Viewer |
| Contact | kentaro.emoto@ tohoku.ac.jp |
Introduction
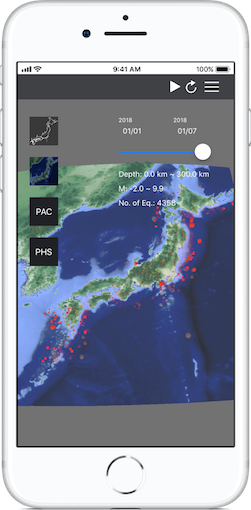
You can see 3D distribution of earthquakes around Japan. You can rotate and scale the view by your finger.
Seismicity around Japan
More than several hundreds earthquakes, including unfelt ones, occur every day around Japan. The distribution is not uniform.
3D distribution
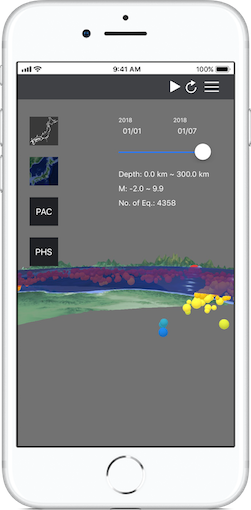
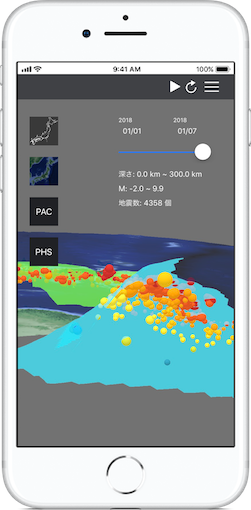
You can easily recognize the location where earthquakes frequently occured by moving, rotating and scaling the view. The information of the earthquake will be displayed by tapping it.
Subducting plate configuration
Subductiong Pacific and Phillipine Sea plates can be overlaid. You can see that deep earthquakes occur along the slub.
Two weeks sample data
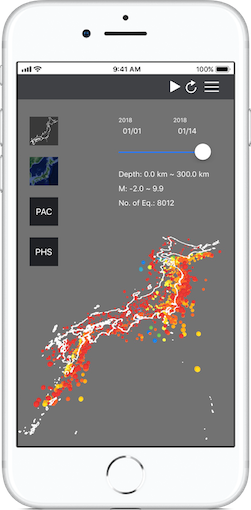
The earthquake catalog from Jan 1 2018 to Jan 14 2018 (two weeks) are preinstalled. This catalogs contain about 8,000 earthquakes. There is no special large earthquake in this period, but you can recognize the usual distribution of earthquakes. You can select the range of the displayed period from the setting view at the upper right button. By moving the slider on the screen, you can change the end date of the display. If you tap the resume button at the top, the slider automatically move and you can see the time sequence of earthquakes.
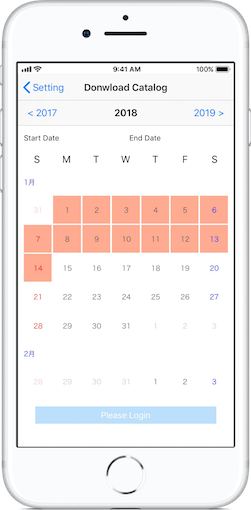
Download additional data
You can download additional catalogs over past 10 years with NIED account.
Data
Hypocenter catalog are provided by NIED (National Research Institute for Earth Science and Disaster Resilience). Hypocenters are determined by the NIED Hi-net (High-Sensitivity Seismograph Network) hypocenter determination system.
The numerical data of Pacific and Phillipine Sea plates were downloaded from the website of Dr. Fuyuki Hirose. In the data, results of following researches are compiled: Baba et al. (2002, PEPI), Hirose et al.(2008, zisin), Hirose et al. (2008, JGR), Kita et al. (2010, EPSL), Nakajima and Hasegawa (2006, GRL), Nakajima and Hasegawa (2007, JGR), Nakajima et al. (2009, JGR)
The land topography and ocean bathymetry data were extracted fromETOPO1provided by NOAA (National Oceanic and Atmospheric Administration).